Listen to this article:
Every organization runs on two engines: structure and connection. Structure defines the roles, teams, and goals. Connection defines the relationships, trust, and collaboration that make them work.
The problem we see more and more often?
Even modern companies rely on traditional reports and dashboards that only capture the structure. They show what is supposed to happen, not how work actually flows.
That is why a new generation of network dashboards is changing how leaders see their organizations. And this is what we’ve achieved at Mirro through our company culture software. We’ve given “culture” a face with accurate data and visual graphs.
Read along to understand why you need to access company culture analytics to shape and sustain a high-performing workplace.
Understanding performance: the Performance Network
The Performance Network reveals the relationship between performance managers and their teams over a specified period. The strength of a link between two people depends on the number of check-ins shared and finalized, feedback and kudos provided, feedback requests, and comments on the performance check-ins.
The more interactions they had during the selected period, the stronger the connection would be, and the two colleagues would be shown closer together.
What stands out in this dashboard is how interconnected yet uneven most organizations really are. Some clusters are tightly knit and highly interactive, while others are more isolated, showing both strengths and areas for improvement.
Key insights for leaders:
- Larger nodes indicate managers with too many direct reports, which can potentially create bottlenecks in coaching and feedback;
- Highly connected clusters reflect engaged teams, while dispersed ones may indicate disengagement issues;
- Employees linked to multiple leaders or teams reveal organizational transitions and cross-functional influence.
☝️ This network gives leaders context into the “how” behind performance. It provides valuable information for your company’s succession planning.
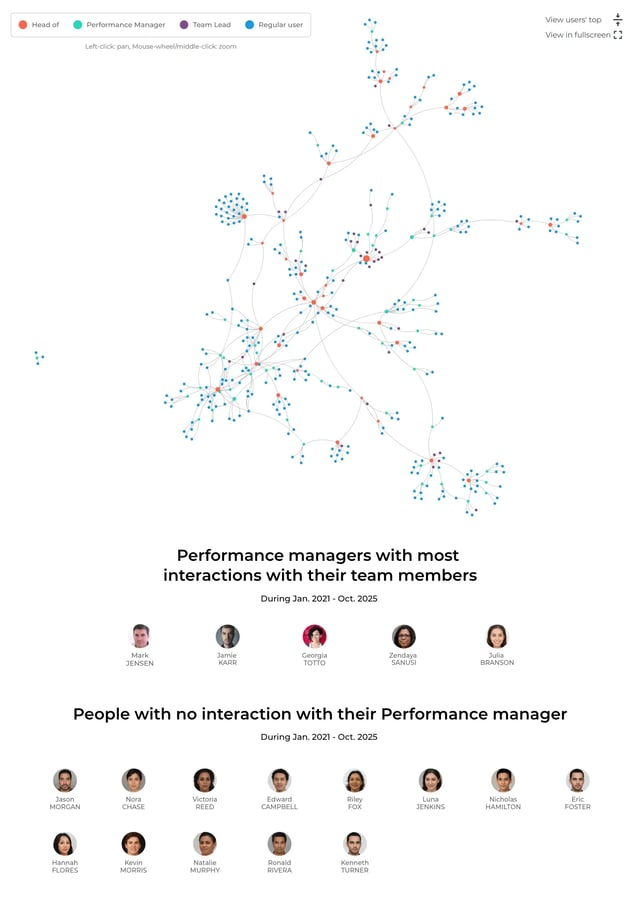 Mirro's Performance Network
Mapping culture: the Feedback and Kudos Network
The Feedback and Kudos Network reveals how recognition and feedback are shared throughout the company. Each connection represents real moments of feedback or praise, visualizing how cultural energy moves between people. The link between two people depends on the number of feedback and praise they give each other over a specified period.
Key insights for leaders:
- Larger nodes indicate people who are active in giving or receiving recognition and/or feedback. They are your culture drivers and can be hidden ambassadors;
- Mutual connections highlight strong, trust-based relationships;
- Look for drivers, connectors, and outsiders: drivers fuel recognition and positivity, connectors bridge groups and spread cultural alignment, while outsiders may signal disengagement or inclusion gaps.
☝️ This network helps leadership nurture a culture of peer-driven recognition and continuous feedback.
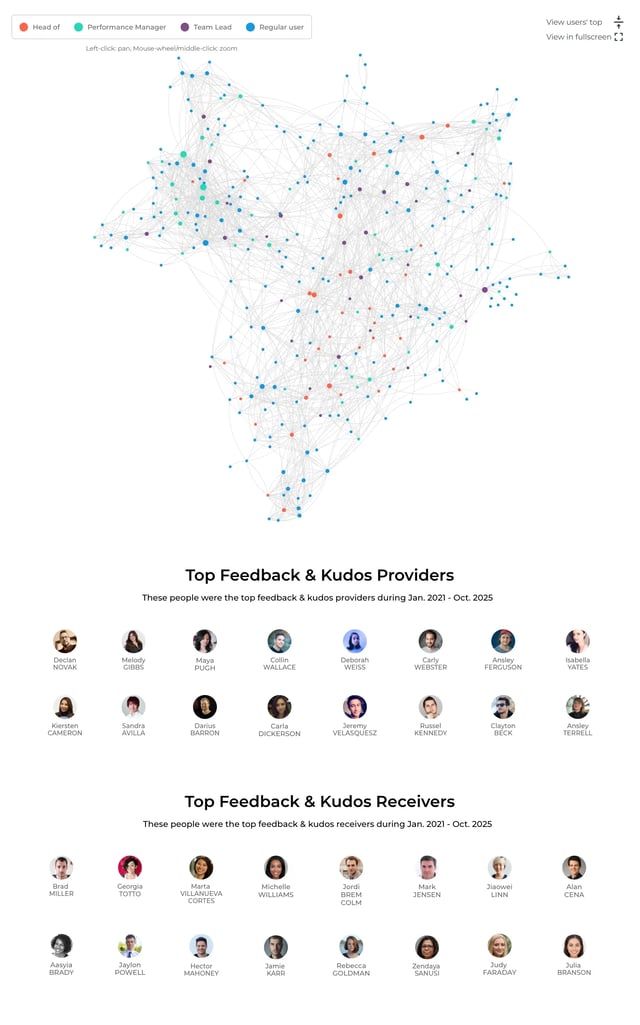 Mirro's Kudos and Feedback Network
Achieving alignment: the OKRs Network
The OKRs Network shows how people align through shared objectives and key results. Each connection represents colleagues working toward a common goal, turning business strategy into visible collaboration. Two people are connected if they share an active OKR during a selected period, meaning they are either owners or contributors for those OKRs.
Key insights for leaders:
- Larger nodes show individuals contributing to multiple OKRs. These are often key people driving execution;
- Cross-functional connectors ensure information and accountability flow across silos;
- Isolated clusters may reflect teams working in silos, signaling areas where alignment can be improved.
☝️ The OKRs network helps executives visualize how goals connect people. It ensures the organization is not just executing tasks but advancing toward shared strategic outcomes.
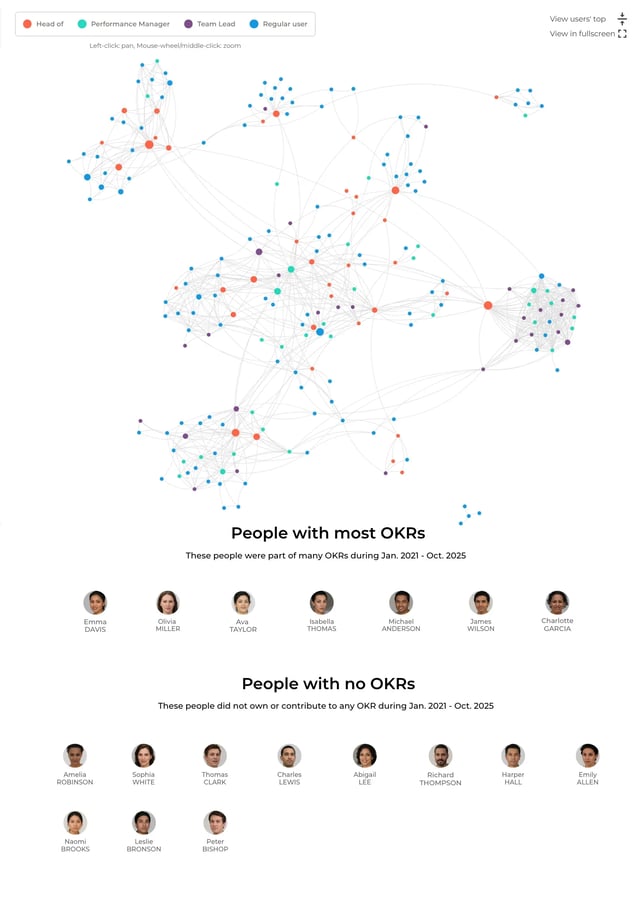 Mirro's OKRs Network
Understanding collaboration at scale: the Teams Network
The Teams Network reveals the teams and individuals who are part of one or more teams, exposing the real web of collaboration. Two people are connected if they are part of the same team for the selected period.
Key insights for leaders:
- Node size increases with the number of teams an employee belongs to. This helps identify collaboration multipliers;
- Individuals who link multiple teams accelerate knowledge sharing and alignment;
- Teams or individuals who are secluded may need reintegration or refreshed goals;
- Overly dense networks might signal outdated or overlapping team structures.
☝️ This visualization ensures team design remains agile, intentional, and aligned. It helps organizations avoid drift and maintain clarity in collaboration.
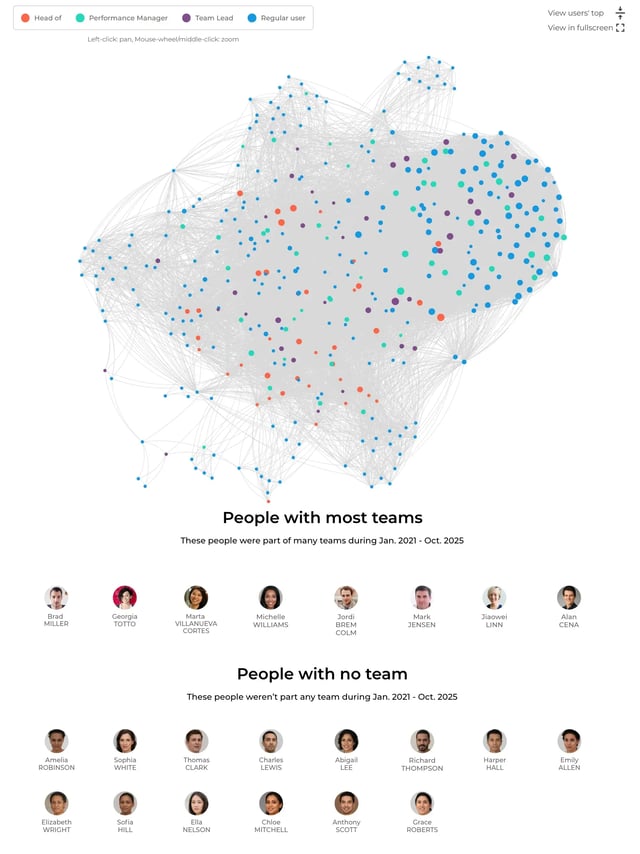 Mirro's Teams Network
Visualizing engagement: the Social Network
The Social Network shows how people react, comment, and engage with each other’s posts. These patterns reveal the social fabric that fuels culture, belonging, and morale. Each link represents social interactions, such as likes, reactions, and comments, forming a visual map of engagement.
Key insights for leaders:
- Larger nodes represent users who interact frequently with each other’s posts, helping identify engagement champions;
- Those who give and receive many reactions are cultural connectors, the ones who keep morale high across teams;
- Individuals with few connections may need re-engagement or inclusion efforts;
- Users who receive frequent interactions but give few may hold influence, while those who engage broadly help sustain culture.
☝️ This network gives leaders a pulse on informal culture dynamics. It reveals who shapes conversations, connects colleagues, and drives internal engagement.
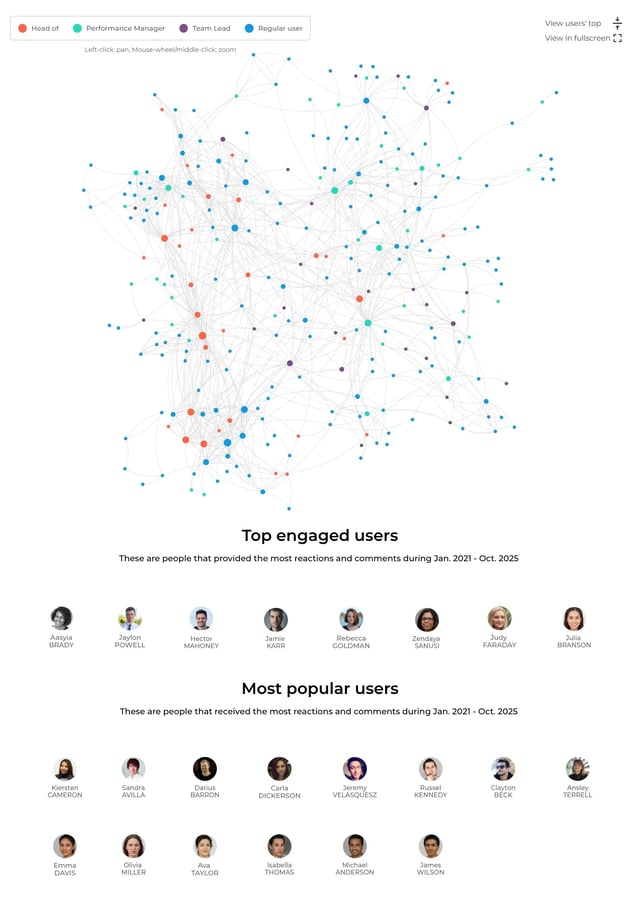 Mirro's Social Network
From data to action
By combining insights from all five networks (Performance, Feedback & Kudos, OKRs, Teams, and Social), leaders gain a complete view of how their organization truly operates. To sum up:
- The Performance Network shows how teams work;
- The Feedback and Kudos Network shows how they connect;
- The OKRs Network shows what they are working toward;
- The Teams Network shows where collaboration happens;
- The Social Network shows how culture flows.
By visualizing real connections, from feedback to OKRs, from team membership to social interactions, these dashboards help HR and business leaders understand how people truly work, align, and connect.
Closing thoughts: seeing the human side of strategy
Success is not just about having a clear strategy. It is about seeing how people bring that strategy to life. Network dashboards help organizations make the invisible visible: the connectors, the outsiders, and how culture is lived.
For HR and business leaders, these analytics provide valuable insights to understand, measure, and improve the company culture. Book a demo with us and let us show you how to leverage these dashboards.